Add Value to Formula Program with Smart Spot Buys

Published: September 29, 2023
Value
DecisionNext customers save on average $0.05-0.20/lb when we quantify the impact of spot market decisions compared to formula prices during the same time periodDecisionNext customers save on average $0.05-0.20/lb when we quantify the impact of spot market decisions compared to formula prices during the same time period.
Problem
- Your volume is locked up on formula pricing, leaving very little room for increased profitability.
- Protein buyers don’t have the tools they need to quickly and accurately assess different buying strategies — so they simply stick to formula buys, leaving money on the table.
Solution
Understand expected return in the spot market over formula commitment.
- Analyze key indicators for change in the market with DecisionNext Direct.
- Quickly identify time periods where the spot market is cheaper than the current formulation with DecisionNext Transaction.
About DecisionNext DecisionNext is a best-in-class AI platform that empowers companies to buy or sell at the best times, with the best formulas, at the best prices. Built in collaboration with our customers, DecisionNext has revolutionized how price and supply forecasting can improve business decisions. And it is the only platform that incorporates users’ wisdom in its algorithms! Our case studies illustrate real world examples of how our platform has helped customers. Please reach out with questions or for a deeper dive into our solutions.
The Scenario: Buying options for Ground Beef
A buyer had 100% of their out front volume needs tied to a formula price. This formula is based on a floating market price and an overage.
But is this the best way to structure their purchasing strategy?
What happens if they take a portion of that volume and decide to shift it into the spot market? What if they take a fixed quote based on the spot market price today? What tools does the buyer need to visualize the outcome of that decision?
What the buyer needs is a tool to efficiently and accurately evaluate the risk around the outcome of each purchasing strategy. The options in this example are:
- Take a fixed quote today
- Buy on the spot market
- Buy half now, and half on formula
- Buy 100% on formula
The DecisionNext Transaction Application allows the buyer to evaluate the risk associated with each alternative buying strategy (Fig. 1).
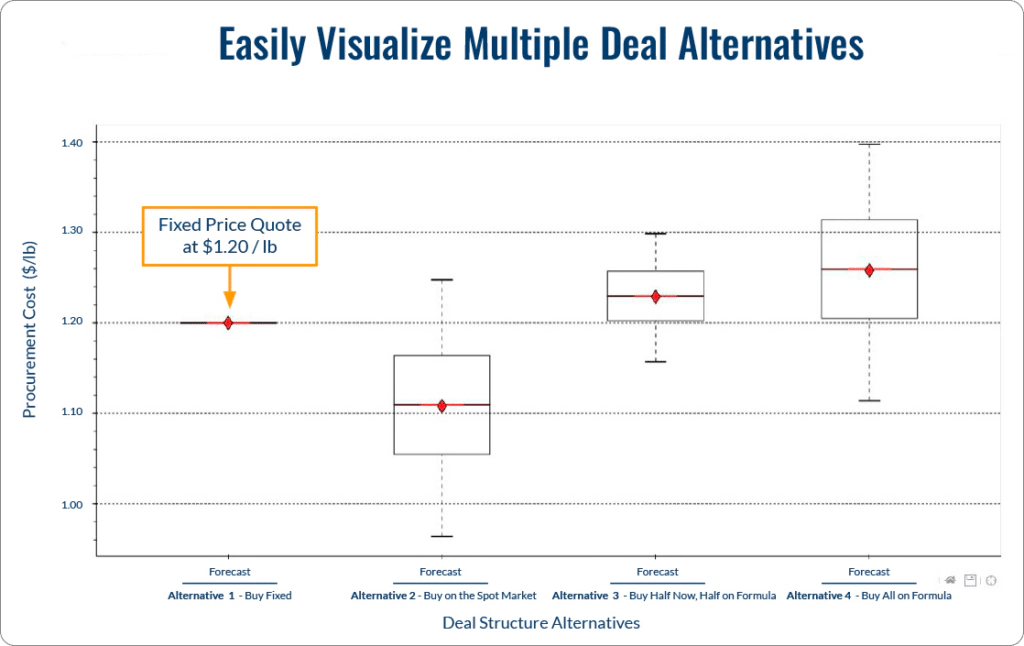 Figure 1 - Box & Whiskers Plot1 comparing four different transaction alternatives to evaluate risk / procurement cost.
By definition, the fixed price alternative has no associated risk as the price has been negotiated up front. Comparing Alternatives 3 and 4, where the cost of the product is tied to a future market price with a premium, you see that the expected outcomes (red lines) are forecasted to be slightly higher than the fixed quote (Alternative 1) which might suggest that the premium tied to buying half now, half on formula (Alternative 3) and buying all on formula (Alternative 4) is keeping them competitive with the fixed quote (Alternative 1). If you look at the box & whiskers you will see that there is a chance that it comes in less expensive than Alternative 1, but a higher chance they will be more expensive (Fig. 1).
If we look at Alternative 2, where we are waiting until next month to secure the volume on the spot market, the expected outcome (red line) is showing savings anywhere from 15 - 25 cents per pound when compared to the fixed quote. In this scenario, it is unlikely that this buyer would risk 100% of the volume to make that spot market bet (Alternative 2), but this may give the buyer confidence to shift some of that required volume to bet on the spot market play. DecisionNext can help give confidence to buyers in certain instances like this one to make real time shifts in volume and help achieve bigger overall savings when looking at an entire portfolio.
When a buyer has confidence in the spot market price of an item, they can move a larger percentage of their volume out of formula and fixed and into the spot market, resulting in large savings (Fig. 2).
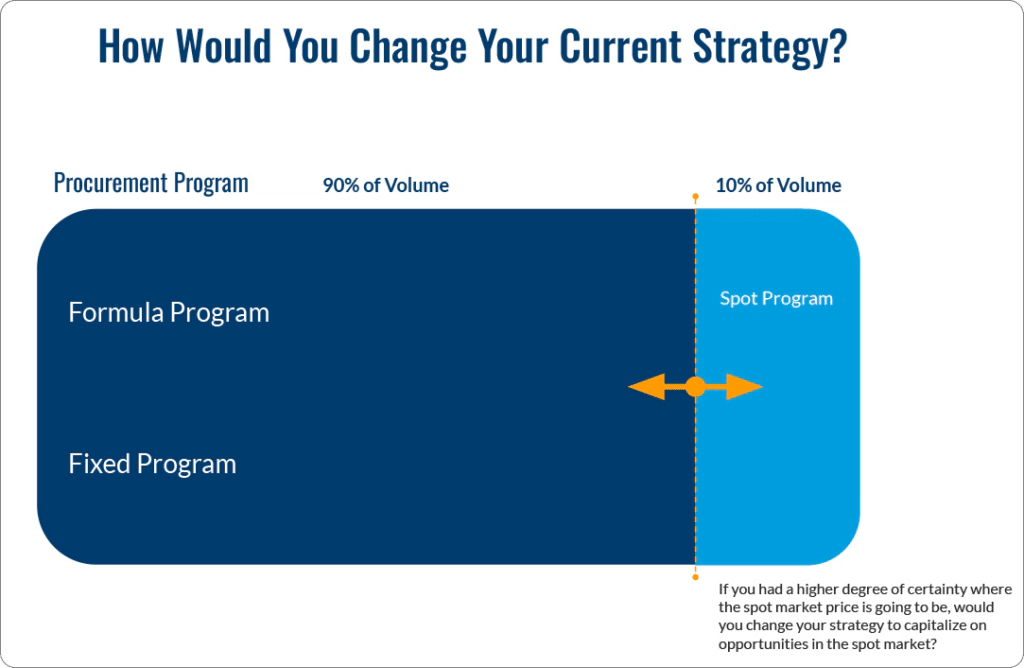 Figure 2 - Graphical depiction of a protein procurement program, with the vast majority of the volume on formula/fixed.
Peace of mind
The DecisionNext software allows the user to save or ‘lock’ the market forecast for any decision **at the time it was made (**Fig. 3). This provides a reference point for scorecarding market buys. And it simultaneously empowers and trains buyers to make better decisions in the future.
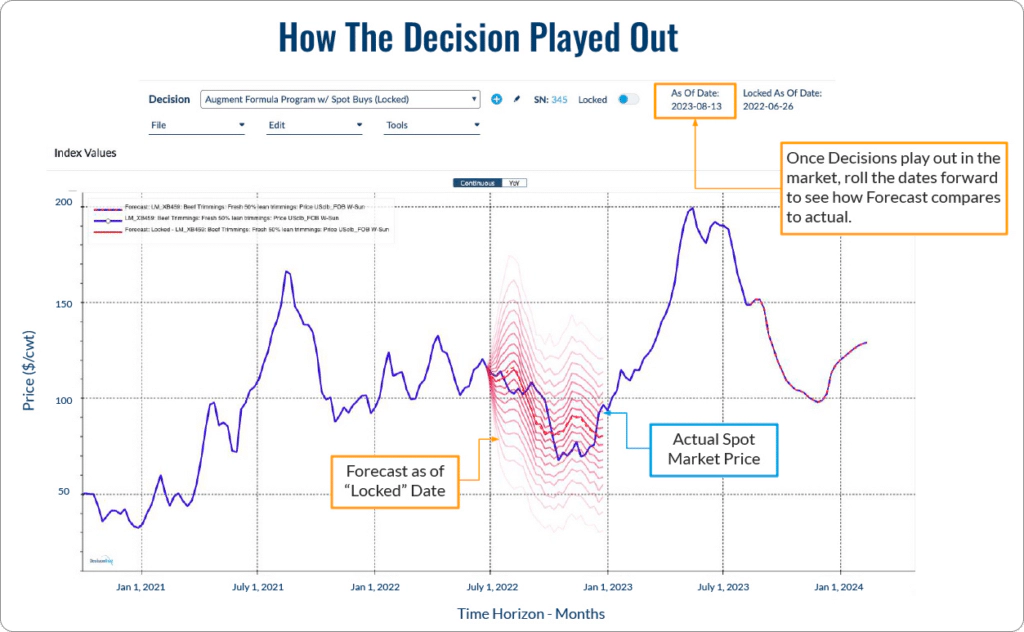 Figure 3 - Timeseries Plot2 from the DecisionNext tool demonstrating how you can ‘lock’ forecasts as of the date of the decision to see how you performed given the information you had at the time.
Best in class forecasting combined with AI-assisted decision simulation tools gave this buyer the confidence to shift a portion of their formula volume to the spot market at the right time, resulting in huge savings.
By using the DecisionNext platform to compare different procurement alternatives, the protein buyer was able to save $0.15/lb (Fig. 4).
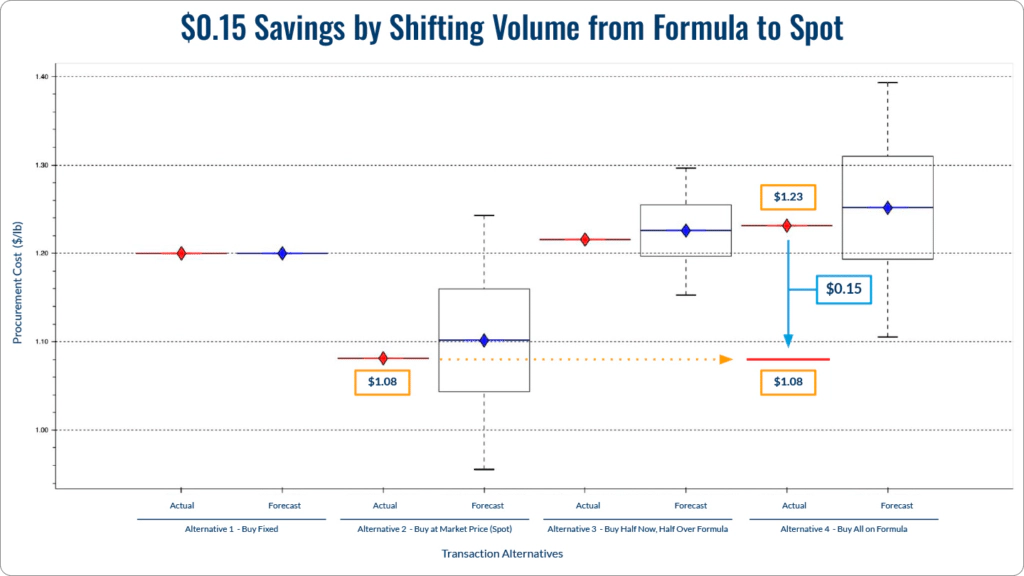
Figure 4 - Box & Whiskers Plot1 comparing the four decision alternatives where the box and whisker shows the original projection on the date of the decision and the red lines show what that decision would have actually yielded given the movement of the market.
Want to share this Case Study?
Copy and paste the URL or download a PDF to send to your colleagues! 
Helpful definitions
1Box & Whiskers Plot: Quantifies the expected value (red line) and risk (whiskers) of a given alternative based on hundreds of thousands of simulations for the forecasted commodities. The red line represents the mean expected value, the box represents where 50% of the simulations fell, the whiskers represent 90% of the simulations. The wider the whiskers, the more uncertainty or risk there is a decision.
2Timeseries Plot: This graph displays the price of the commodity on the y-axis and time on the x-axis. The solid line represents historical values, whereas the dotted line represents the mean expected forecast from that point forward. The lines around that represent the risk or uncertainty as confidence intervals based on hundreds of thousands of simulations.