Comparing Three 81% Ground Beef Formulas
Published: July 13, 2022
In a normal market beef trim prices fluctuate dramatically day-to-day and having multiple options to reach a lean point or blend can result in millions of dollars of savings. If your desired lean point is 81% there are multiple blends that could achieve this. For instance, you could have a mix of:
- Ground beef 81 market
- Formulated 81s using 90s/50s
- Formulated 81s using 85s/65s
- Etc.
How do you determine which one is the most cost effective today and up to 6 months into the future?
With DecisionNext, you can create templates that allow you to eliminate ad hoc reporting and automatically generate customized reports on a weekly basis with updated data inputs.
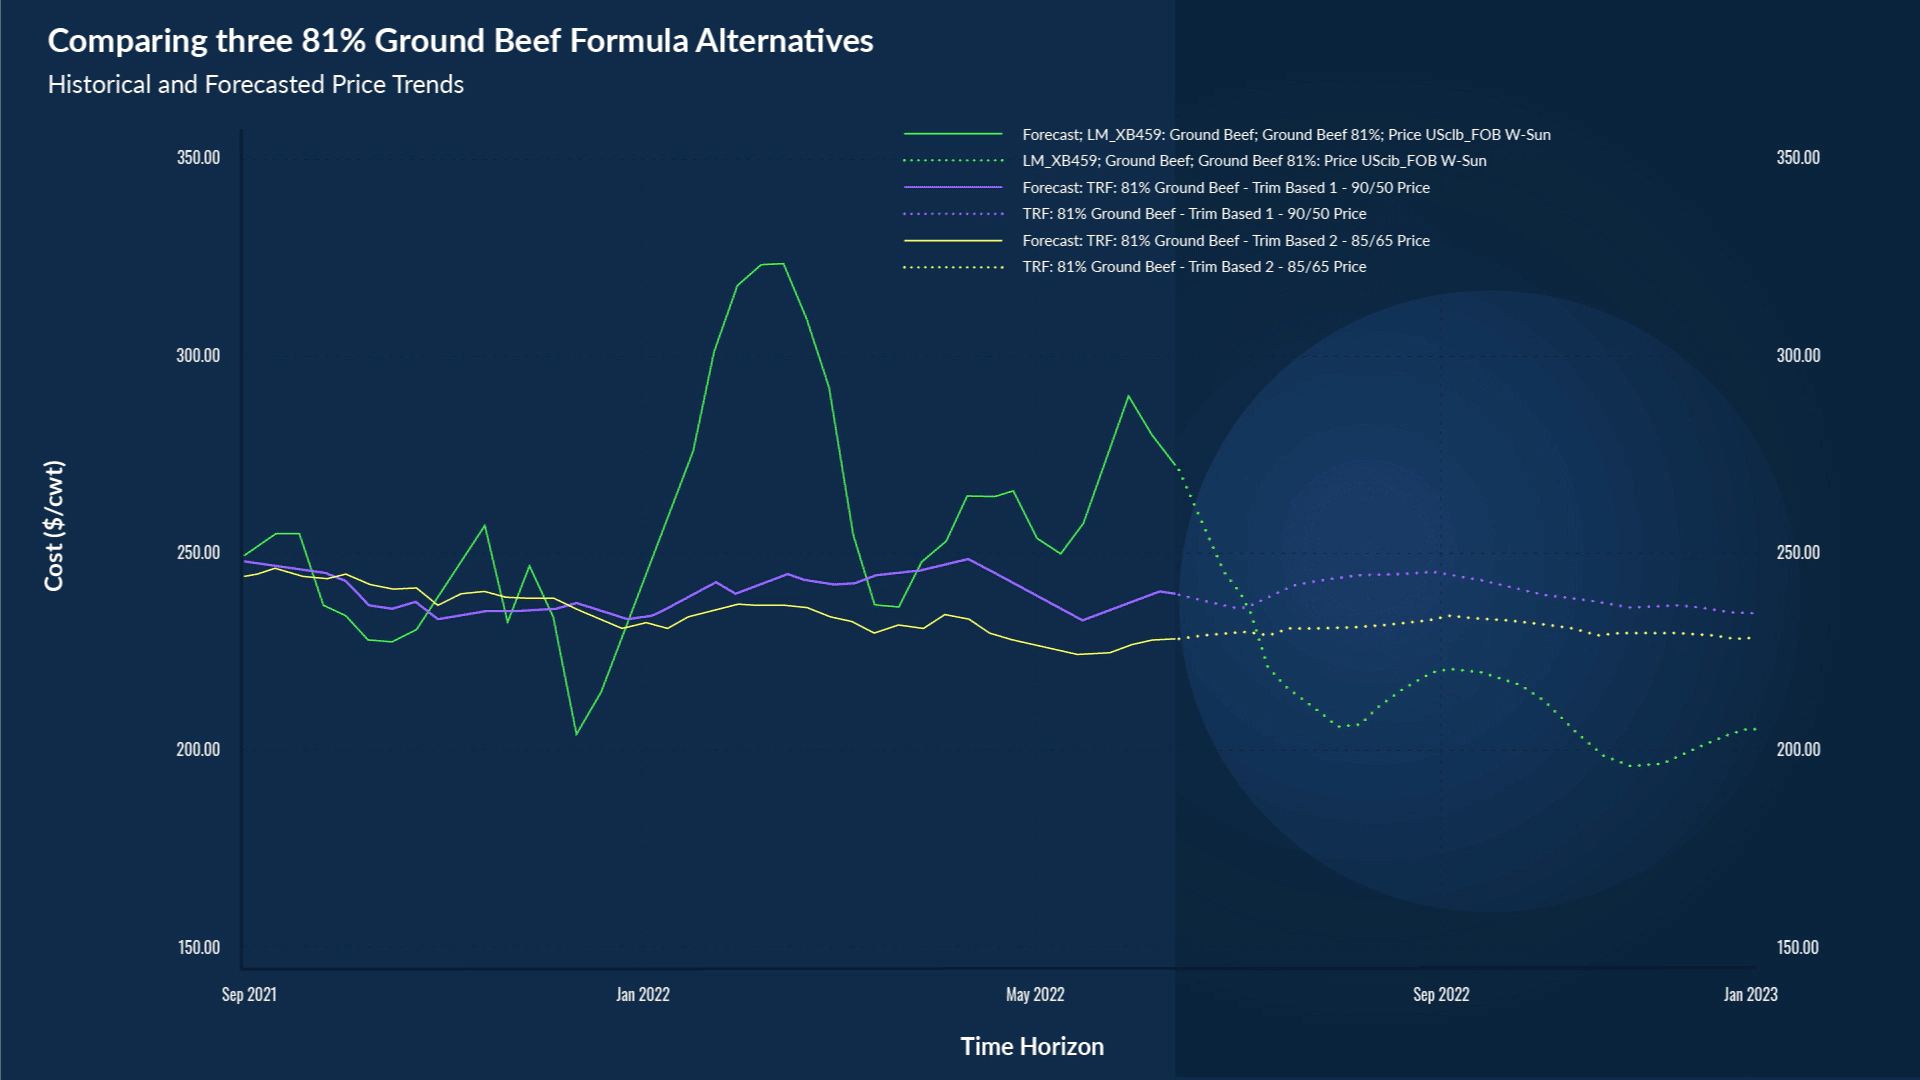
Below is an example of a graph pulled from the DecisionNext platform. The solid lines on the left probably look familiar to you, as they chart the historical price trends of three different 81% grind formulas from Sept. 2021 through July of this year. The dotted lines on the right side compare the forecasted price for the same three distinct 81% grind formulas 26 weeks into the future.
Graph comparing the historical price trends (solid lines) AND the forecasted price (dotted lines) for three different 81% grind formulas.
While it is useful to see the historical spreads between the different 81% formulas and the forecasted trend lines for the same series, this is only a small part of the picture.
In the image below, you can see how simple it is to set up a weekly report resulting in a cash flow statement comparing multiple different 81% grind formulas. The white boxes contain the different scenarios while the box and whisker graph below quantifies the upside and downside risk of each option for any given week.
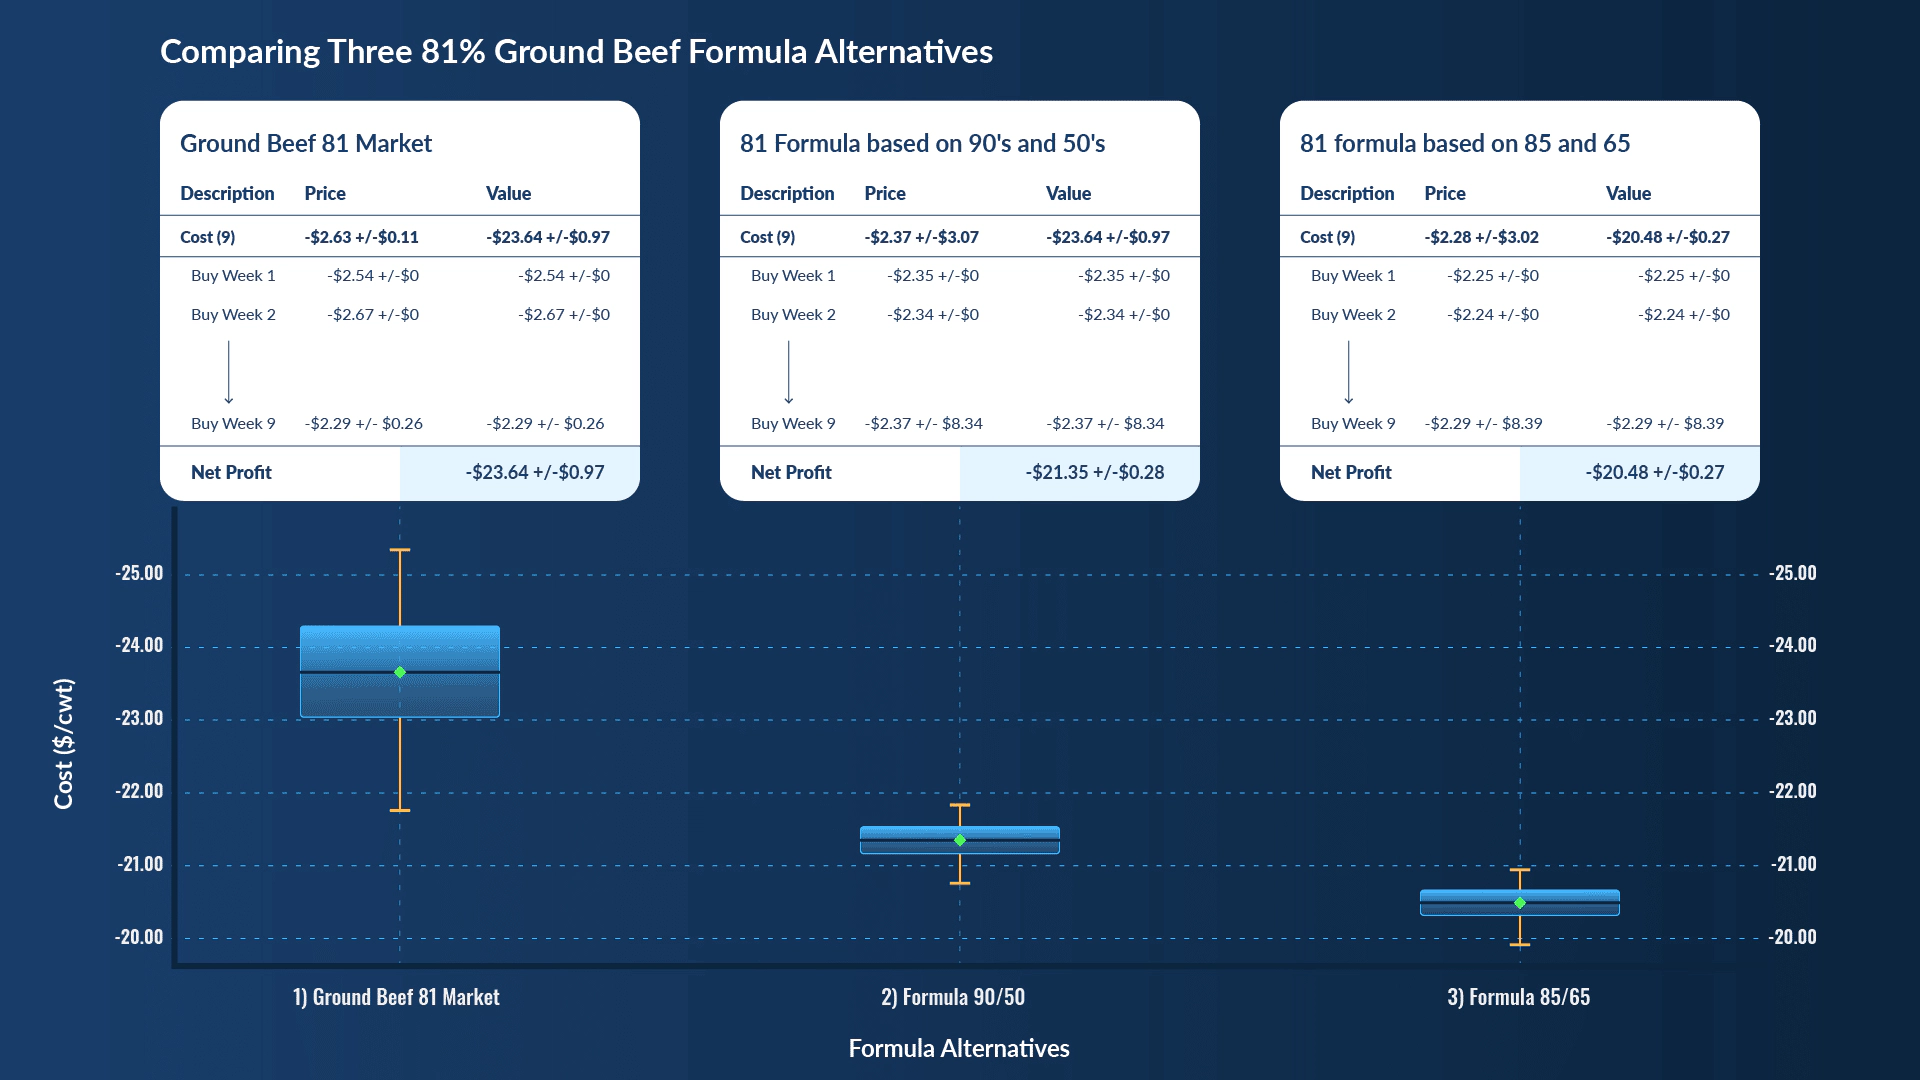 For the box and whisker plots above the black line in the center of each plot is the expected value. Note that 50% of the simulations fall within the box and 90% fall within the whiskers. The tighter the whiskers, the more certainty there is in the forecast.
The green diamond represents the median forecast resulting from running upwards of one million simulations. The real power in this graph is finding the confidence intervals, represented by the whiskers (orange lines extending off of the blue boxes). After running a million simulations, 90% fall within the whiskers while 50% fall within the box. This simple visual helps your buyers understand how much confidence they should have in the price forecast, empowering them to make more informed decisions.
Our retail customers use this particular function of the DecisionNext platform to evaluate which grind composition will yield the largest profits/keep costs the lowest. They can then use this information to negotiate with their suppliers before placing orders and when setting up their buys, formulas, and ad plans.
This evens the playing field when it comes to the negotiation table. You now are equipped with the same (or better) information your suppliers use to give you pricing for your contracts. This tool can even provide you with an opportunity to shorten your contracts to accommodate volatile pricing.
This is just one example of how our customers use the DecisionNext analytics platform. Other examples include ad planning, finished goods optimization, etc.
Click the button below to book a demo with one of our protein experts.