Market Forecasting—Part 1

Published: July 27, 2023
DecisionNext CEO and co-founder Mike Neal and his team have done a lot of interesting thinking around decision making, forecasting and AI technology over the years. In this two-part how-to series, Mike brings it all together and shares valuable market forecasting insights and modeling knowledge that can help you make smarter, more informed decisions.
What is Market Forecasting?
It’s not forecasting in general we’re talking about, it is market forecasting. When we say market, we mean the interaction between price, supply, and demand. To get a better idea of the future state of the market, we need to ask three questions: What will the price be? What will the supply be? And what will the demand be? You’ll find the answers are usually related very tightly.
How to do it
1. Start with a simple, useful model
When building a future-predicting mathematical model, you’ll be tempted to add as many variables as you can. Don’t do it. Complex models are often the result of including all the variables that resulted in the current state of the market. In essence, complex models are effective for predicting the past.
Instead, keep the model simple. The goal should be to use as few variables as possible and still get a reasonable model (Fig. 1). But in order to make it useful, you’ll need to perform tests to decide which variables are going to be the most helpful moving forward, not just looking at your historical data.
 Figure 1 - Simple models are often better at predicting the future while complex models are effective at predicting the past.
2. Use caution when selecting variables
Building models is full of risk because the world is complicated and hard to predict. People naturally tend to look for cause and effect in models, often assuming correlations that don’t actually exist. While the model should be used to identify these correlations and validate them, they shouldn’t be built on pre-existing assumptions of what variables are correlated. Finding two variables that are correlated, like today’s and tomorrow’s price (Fig. 2), is the start of the journey to uncover these causal relationships.
 Figure 2 - The real world is complex and modeling may not simply rely on logical variables.
3. Remember, models alone lack intrinsic value
Virtually every industry has adopted analytics recently. Models are getting increasingly powerful and can provide useful information about future market states. But it is not the model itself that provides intrinsic value—it is the decisions that you make based on that model that deliver value (Fig. 3).
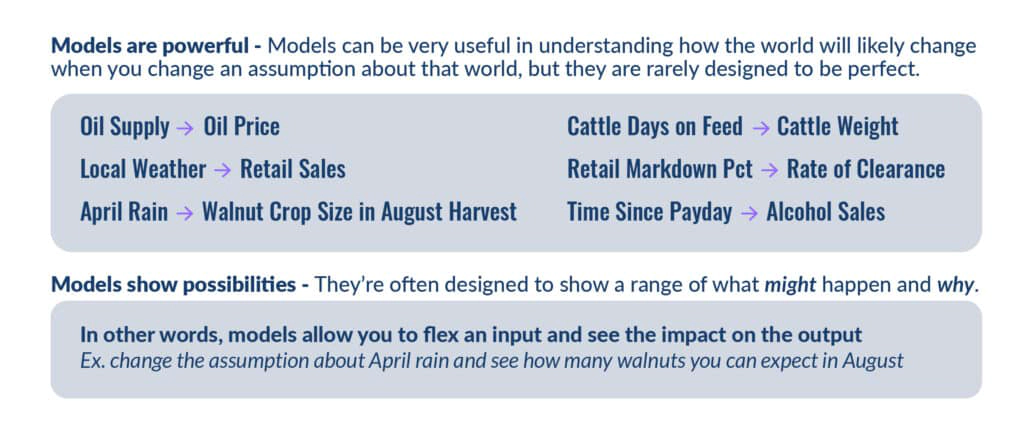 Figure 3 - Models can be useful to show how the outcome may change if you alter an assumption driving the model.
4. Make your models measurable and explainable
When you’re building a model, you need to capture the causal variables as well as the data so you can discern the shape of the relationship. For example, If you change the price of mustard, do you affect hotdog sales? If you change the price of hotdogs, do you affect the hotdog sales? In this example, the causal variables would be the price of mustard and the price of hot dogs, while the data would relate to hot dog sales.
The question to then ask yourself is: How do you narrow down all the potential variables to something that is measurable and explainable? Market volatility creates chaos, and that means holding everything else constant is tough, so you’ll need a lot more data than you would if things were stable.
5. Always try to explain the relationship
Find a common sense explanation for the causality of the variable. If you can’t, try to exclude the variable. Doing this is important because it gives you a better, safer model. Also ensure that you build organizational confidence around the model because then people are more likely to believe its answers. A model that is not trusted is a model that is not used—it’s a waste of time and resources.
6. If penalty for error isn’t high, just go with it
Explanation is less important If the penalty for error is low. Say, for instance, we’re pricing a shipload of a bulk commodity and the price is measured in tens of millions of dollars. In this case,our penalty for error is high. However, if our model predicts what promotion we should put in front of a user on a computer screen, our penalty error is very low because it’s just a single transaction among many. Remember, the importance lies not just in the likelihood of error, but with the associated penalty.
7. Understand the risk to see the opportunity
When modeling, it’s critical to value the weight of risk in your decision making over the weight of the expected values. The idea here is that the actual predicted expected value in any forecast is pretty unlikely. And if this is true, then we should be focused on the confidence in that expected value when making any decision based on it.
In a statistics textbook, you will see beautiful bell-shaped curves (Fig. 4) that illustrate the expected values around a forecast. This is a normal distribution. But the real world rarely, if ever, behaves this way. The real world is full of asymmetry. Dirty data, irrational behavior, fluke occurrences, etc., all contribute to the asymmetry that characterize real data sets.
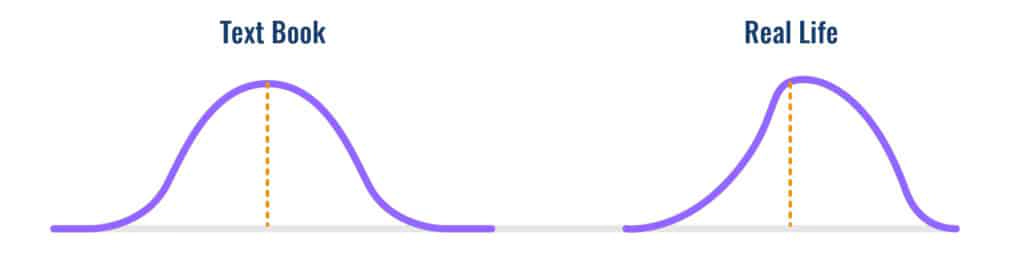 Figure 4 - The big opportunity in leveraging a model is in understanding risk and incorporating it into your decision making process. Use simulation to understand error rates and therefore risks.
As a seller using a forecast to price a commodity for future delivery, you know that the actual unit price will not perfectly match the forecast. It’ll most likely come in somewhere above the forecasted price, or somewhere below. The key is to understand the projected error of that forecast and whether the price is more likely to fall above or below the forecasted price.
In this example, if the seller assumes a normal distribution but given the forecast confidence, the error bands are actually shaped like the Real Life example (Fig. 4) the the seller is then prone to making a bad decision based on incorrect information around risk.
8. Don’t be overconfident
Humans naturally underestimate risk, resulting in very narrow error bands (Fig. 5). It’s critical to compensate for this natural bias.
 Figure 5 - Human imagination minimizes risk associated with a forecasted value. Textbooks portray risk associated with a forecasted value in a normal distribution. But in real life, the risk associated with a forecast can be lopsided.
How to consume market forecasts
9. Be prepared to challenge a forecast
One thing everybody says when they see forecast error bands, is that the error bands are too high. The important question to ask is: Compared to what? Can you beat it? Is there a history of forecasts for this item? How did you account for errors and uncertainty before you could visualize them?
It’s useful to go through this exercise to make sure that we’re framing the problem correctly. Sometimes confidence bands are quite narrow, but usually they’re wider than our intuition would have them be. Being able to lock in a price with a contract now is not the same as forecasting future prices.
Consider if the distribution of error around the forecast was like this illustration (Fig. 6). There’s a big fat area just to the right of the expected value (the tan vertical line) and the downside is a long, skinny curve. We know that depending upon risk tolerance, we may be pretty uneasy about this price commitment because there is a lot of range on the left of the X, which is the minimum price at which to turn a profit. But when you actually look at the distribution of errors, you would never have committed to this price. Thus, it is not just expected value, it is the range that is important.
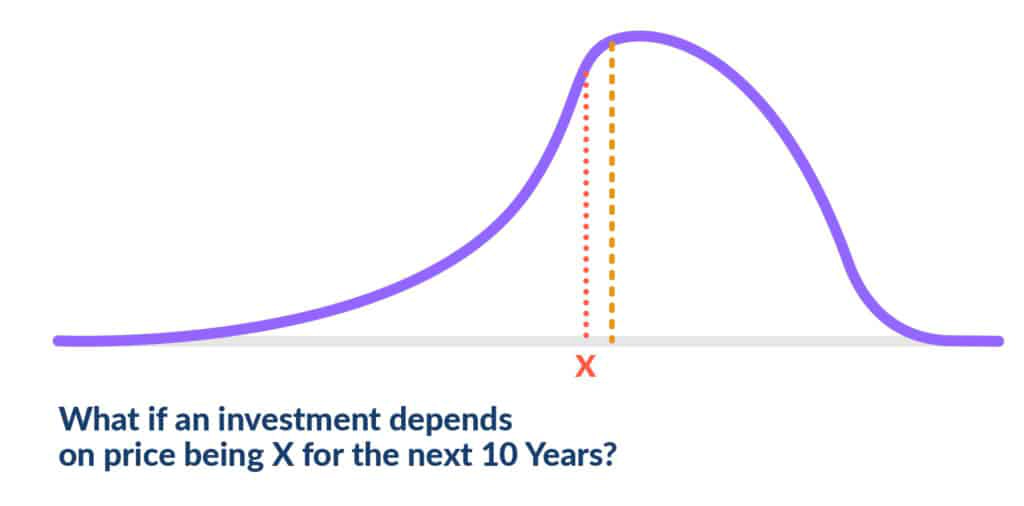 Figure 6 - A common error in consuming market forecasts is to overemphasize the expected value (the tan line) and ignore the confidence bands (the purple line). Bad idea.
10. Build extreme scenarios into your process
Strange things happen. The fact is there are events that completely upend a model and its ability to predict. You need to take a look at extreme scenarios by building “what if” situations into your modeling process. You don’t know when plant fires, government policies, or weather events will occur, but you know that they will. Don’t lose sight of the of black swan events that can have massive effects on your models.
Exercising the model and running extreme scenarios like these should be part of the process. It doesn’t need to be a daily process, but be sure to run it on a weekly or monthly cadence, because there may be times that you find things have actually changed.
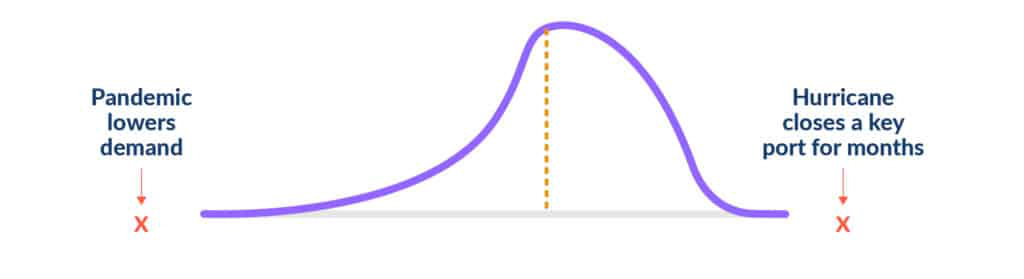 Figure 7 - It is critical to exercise your model by running it through extreme scenarios. This process does not need to be completed weekly, but should be done with some regularity.
Conclusion
Models are powerful tools that can provide you with amazing information. But it’s only powerful if you know how to make the right decisions. By using the 10 market forecasting tips above, you’ll find helpful insights and advice that works best for you and your team. Also, be sure to check out Part 2, where you’ll gain even more valuable insights on how to make market forecasting useful and repeatable. Read it now.
Sign up for our FREE newsletter The Formula.
Want more industry insights, company and product updates? Subscribe to stay in the loop.