Predictive Power that Makes the Cut
Published: October 6, 2023
Cattle ≠ Beef
Starting in 2021, we observed repeated instances of beef price movements diverging sizably from cattle values, suggesting markets were being influenced by external factors. These divergences present serious problems to standard cattle ratio-based beef cut forecast models. In other words, the relationship between cattle prices and beef prices that the industry had come to rely on started to break down. Big time.
So we partnered with some of our largest customers to figure out why these models were breaking down and do something to fix them. Building in statistical methods, we developed models that are significantly more accurate at forecasting beef cut prices in today’s markets.
Time to make a change
Our team of cattle market experts, economists, and data scientists worked to create a model using cutout values that intuitively was more responsive to changes in the cattle cycle, and thereby better at predicting beef values. It’s not that we’re throwing away beef ratio modeling. Rather, we’re supplementing our existing suite of tools to capture the cattle cycle from the perspectives of both demand and supply. To understand why this change in perspective toward predicting beef values is so powerful, take a look at Fig. 1 and the divergence between beef and cattle values.
From 2012–2020, the two series move together in lockstep. In other words, when the live cattle price goes up, the comprehensive boxed beef cutout would go up. In 2021 that changed, and the two series began to diverge with cattle price climbing while the cutout price fluctuated, but remained relatively constant. Over the past six months, this trend has reversed as cattle prices continue to increase with beef demand staying flat.
Over this time period, we have been evaluating and improving our models, fine-tuning them to be even more accurate throughout the cattle cycle.
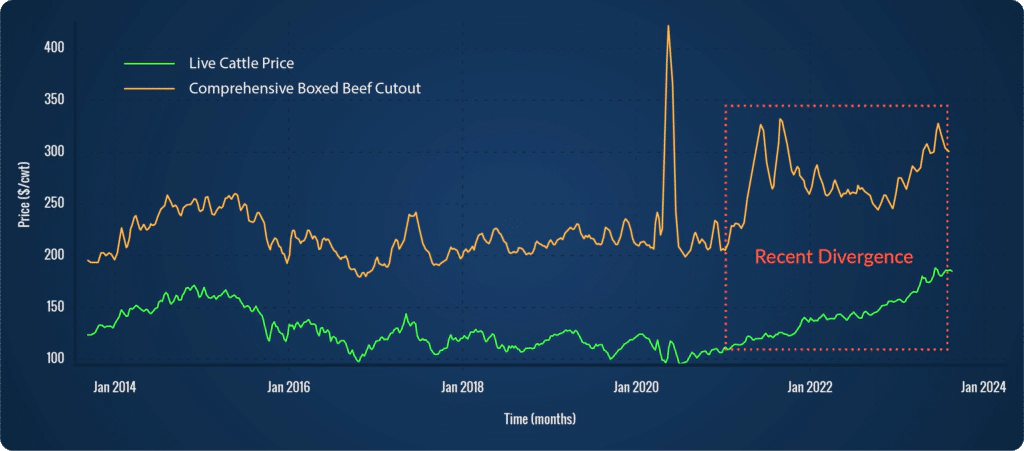 Figure 1 - Starting in late 2021 and continuing through present, there has been a divergence in the historical relationship between the comprehensive boxed beef cutout and live cattle price.
With beef prices driven to all-time highs by consumer demand, a serious disconnect between beef and cattle prices has emerged. Beef prices have remained high, but now the market is bearing the consequence of a smaller breeding herd and fed cattle numbers. As a result, cattle prices are climbing. Any industry standard cattle ratio-based model using the anticipated forecast to price beef will predict that with rising cattle prices, beef prices will follow suit.
But a cattle ratio-based model ignores consumer demand, the very force that has driven beef prices to such lofty heights in the first place.
The historical relationship between cattle and cut has broken down and now the price of cattle only accounts for a small portion of the price of the cut (Fig. 2). This phenomenon is not unique to the Prime grade, but can also be seen across Choice and Select grades as well.
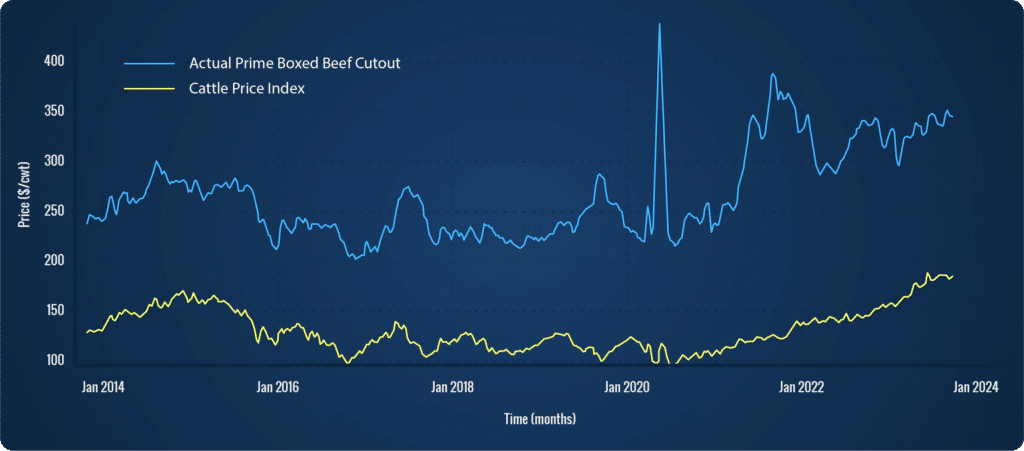 Figure 2 - Graphical comparison of the Prime boxed beef cutout against a linear transformation of the live cattle price to explain cutout.
DecisionNext delivered the innovative Cut to Graded Cutout Model
This new approach is arguably the most important industry forecast modeling tool for today’s beef market uncertainty. Since we rolled out this new model in the back half of 2022, it has demonstrated a dramatic improvement in beef cut forecast accuracy when compared to a cattle-ratio based model. And we expect this improvement in accuracy to continue going forward, especially as it appears less likely the processor will be able to pass on high cattle costs than in previous years.
Alternative meats, such as pork and chicken, simply become more competitive when beef prices alone are high, as well as in the event of any perceived or real macroeconomic slowdown. The cut to graded cutout beef forecasting model is just what the industry needs.
The key is understanding what the cut is ratioed against
A traditional live cattle ratio model uses a historical ratio. In contrast, our graded cutout model combines a graded beef cutout forecast and the ratio of the graded cut to the graded cutout (eg. we model choice brisket’s ratio to choice cutout).
How can you be so sure?
To ensure the accuracy comparison between the models, DecisionNext employs rigorous backtesting to look at the historical error rates for weeks into the future. When you run backtesting to compare the accuracy of the two models at predicting the price of Choice Brisket, the cut-to-cutout model outperforms the our cattle ratio-based forecast model by ~$0.09/lb at ten weeks out and ~$0.12/lb at 15 weeks out (Fig. 3).
Ten cents a pound is going to have a massive impact when you are taking positions and/or setting retail ad prices.
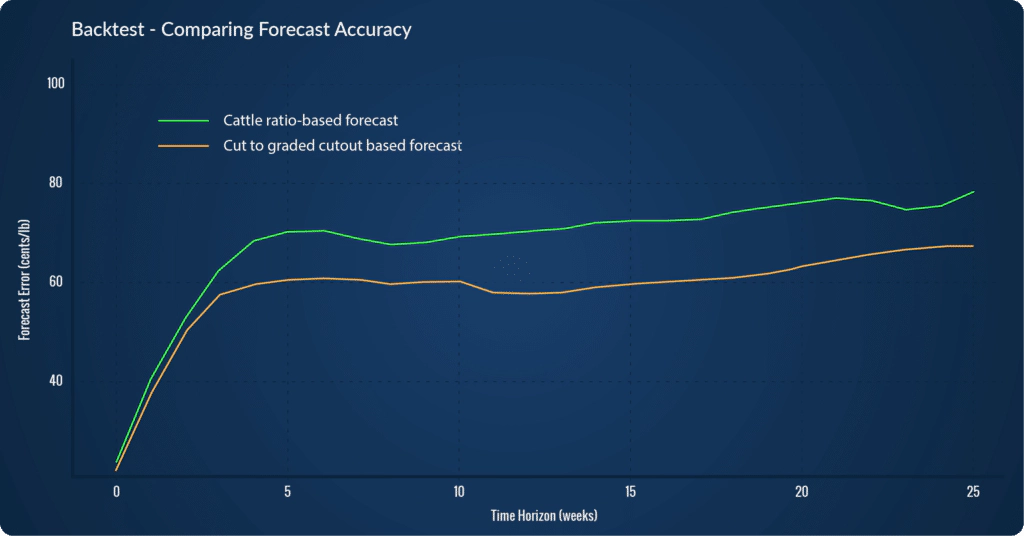 Figure 3 - Backtesting graph demonstrating the accuracy of various forecasts for Choice Brisket up to 0-25 weeks into the future.
You shouldn’t put all your eggs in one basket
If the new cutout model is the best going forward, why have multiple forecasts, you wonder?
Simply put, markets change and each forecast provides a different perspective. For example, cattle ratio-based models are more focused on the supply of animals, where a cutout based forecast focuses on the demand for beef. Though clearly linked, the markets can and do diverge. This could change, and that’s why having model options is key to your success.
The beef industry is constantly evolving and changing
When the gold standard cattle ratio-based model broke, DecisionNext stepped in to fix it with the brand new Cutout Model. The result is a forecast that is more accurate for the state of the market that we are in today. It’s the most important industry forecast modeling tool for today’s beef market uncertainty. In fact, it’s the core competency of continual model evaluation, improvement, and user interaction that allows us to deliver value to the vast range of commodity markets we serve—and to our customers.