Reduction in Cattle Slaughter Impacting Cut Availability

Published: December 8, 2023
As a result of greater beef cow slaughter throughout 2020–2022, the number of finished cattle slaughtered in the first 10 months of 2023 decreased by 4.7% compared to the same period last year. Though this reduction caused a downward volume shift in all beef products, it had varying impacts on cut prices. This is due in part to how meat is priced and the availability of cuts.
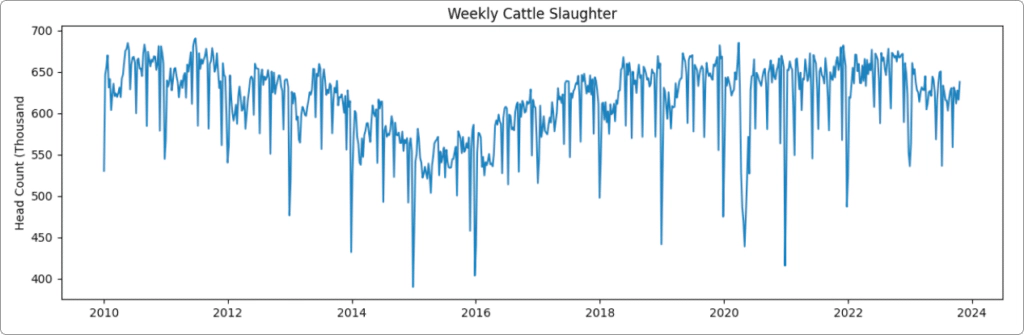 Figure 1 – Weekly Cow Slaughter
To better understand how the availability of beef cuts changes as it relates to supply shifts, we need to consider how cut volumes are traded. The USDA categorizes volumes of boxed beef cuts and trim based on the type of sale: negotiated with spot delivery within 0–21 days, negotiated out front with delivery within 22 days to 90 days, formula, and forward contract. The USDA’s National Boxed Beef Weekly Item Summary (LM_XB864) provides a weekly summary of the volume of cuts sold and their pricing.
Getting to know the differences in transaction types provides valuable insight on availability in a market with shifting supply. Sales through formula pricing and forward contracts tend to be more rigid and predictable, serving as a type of “base load” to the market. The contract pricing sets volume and price for a forward timeframe. It also provides guaranteed supply to the buyer and a forward position volume for the packer to source animals. Formula price is unknown when contracts are specified, as it’s typically determined by a formula off of the negotiated spot market.
Here’s an example that can help us grasp the significance of the meat pricing channel in determining the price, especially when the supply of animals is low. Consider an analogy with a bathtub and a swimming pool, where each contains a toy boat. If we remove five gallons of water from the already-full bathtub, the toy boat will fall much further than if we remove the same amount of water from the full swimming pool. The volume of the negotiated market is comparable to the quantity of water in each container. So when the overall market supply declines, such as lower slaughter head count, the volume in the market with proportionally less negotiated sales (thus inversely more formula) will be more unstable (like the bathtub) than one that is concentrated by large negotiated volumes and proportionally less formula (like the swimming pool).
In this case, it’s because the formula demand is unresponsive to prices. It’s a volume supply chain agreement between buyer for their bought position and seller for their sold position. The buyer gives up timing their buys to guarantee the supply of meat. The seller similarly gives up timing of selling their inventory. The “leftover” volume after what’s subtracted from formula buys determines spot volumes and prices. More formula-centric markets are very likely to face price volatility and higher prices as animal supply declines because they have less wiggle room as the body of water shrinks. This implies that negotiated markets not only set their own prices, but those are also passed on to formula values as well.
Below is a chart showing the evolution of formula volumes for a fed beef cut and beef trim. Both beef products are primarily sold through formulas. The eye of round has shown an increasing tightness in spot volume as the formula captures larger percentage shares. Surprisingly, beef 50% trim, which is also heavily traded on formula, has decreased in the percentage consumed by formula, after peaking in the spring of 2023. Keep in mind, the supply of both cuts comes from the same slaughtered cattle, and that they each declined in volume supplied in the first 10 months of 2023.
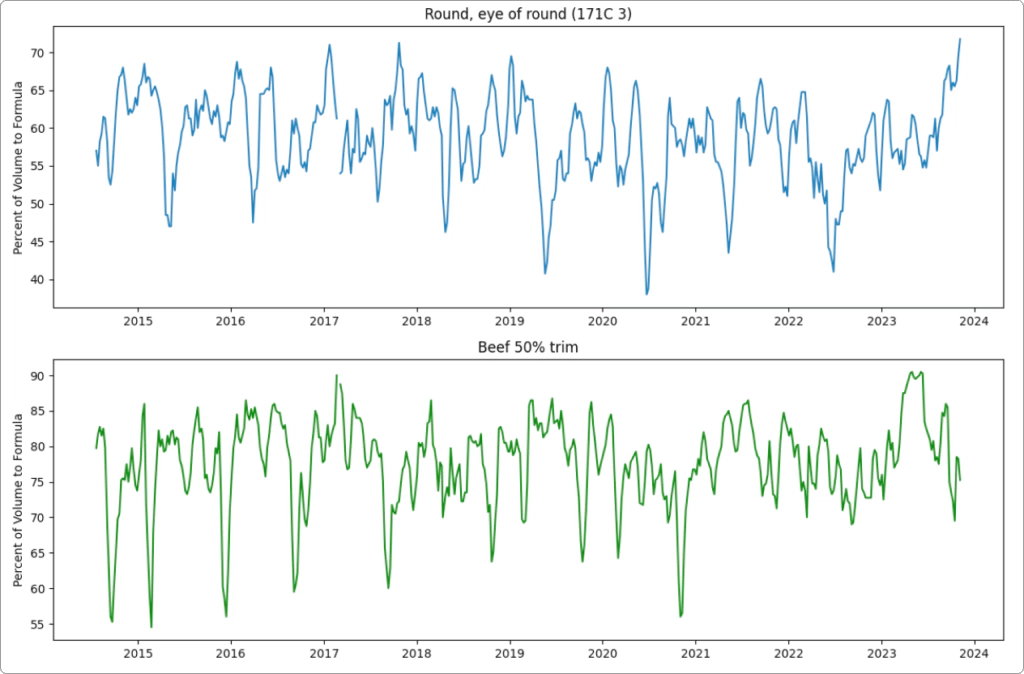 Figure 2 – Chart showing the evolution of formula volumes for a fed beef cut and beef trim
The table below breaks the data into all the cuts and trim reported in the weekly item summary. It presents how the formula volume relative to total loads has averaged over the past five years, the most recent weekly summary (four week rolling average), and how this is relative to a year ago. Higher values are suggestive of a tighter negotiated market.
Boxed Beef cuts and trim
Latest (4 week average)
Five year average
Relative to a year ago
Round, bottom gooseneck (170 1)
30
14
16
Round, eye of round (171C 3)
72
58
15
Rib, ribeye, lip-on, bn-in (109E 1)
58
47
14
Loin, tndrloin, trmd, heavy (189A 4)
51
43
13
Cap Wedge IM lean
67
54
13
Chuck, roll, lxl, neck/off (116A 3)
60
48
11
Ground Chuck
73
66
11
Pectoral Meat
53
43
11
Loin, top butt, bnls, heavy (184 1)
61
54
8
Brisket, deckle-off, bnls (120 1)
55
54
7
Chuck, chuck tender (116B 1)
54
52
6
Round, top inside round (168 3)
38
31
5
Rib, ribeye, bnls, heavy (112A 3)
66
61
4
Round, top inside round (168 1)
54
61
4
Rib, ribeye, bnls, light (112A 3)
58
47
4
Loin, strip, bnls, 0x1 (180 3)
49
51
3
121D 4 Plate, Inside Skirt
63
58
3
Chuck, shoulder clod, trmd (114A 3)
50
55
3
Round, knuckle, peeled (167A 4)
65
56
2
Loin, ball-tip, bnls, heavy (185B 1)
60
59
2
Round, outside round (171B 3)
46
42
1
Ground beef 93% lean
80
80
1
Ground round
74
77
0
Loin, short loin, 0x1 (174 3)
42
41
-1
Loin, sirloin, tri-tip (185C 1)
35
42
-1
Fresh 50% lean trimmings
75
78
-2
Ground beef 81% lean
69
72
-4
Chuck, shoulder clod (114 1)
46
42
-5
121C 4 Plate, Outside Skirt
51
47
-5
Loin, bottom sirloin, flap (185A 4)
57
59
-6
Flank, flank steak (193 4)
62
70
-7
Ground beef 73% lean
65
66
-8
Loin, top butt, boneless (184 3)
39
43
-10
While this information is key to understanding the tightness of negotiated markets, it’s just one indicator of market directionality and potential volatility. Depending on your beef cut, this analysis may or may not challenge you to change your bought or sold position pricing program. But at the least on a highly formulated product it will make you want to relook at your budget forecast. A tighter negotiated market typically helps to explain higher prices but can also muddy other important market factors, such as demand shocks.
Stay tuned here as we continue to breakdown the complexities of the beef market. And If you have any questions on how this might impact important cuts to your business, reach out to us at info@decisionnext.com.
Sign up for our FREE newsletter, The Formula.
Every month you’ll get a Finished Good Report along with a deep dive, so you can start to track important trends over time.