The DecisionNext Finished Goods Indices – March 2024

Published: March 4, 2024
Finished Goods Forecast Indices: April 2024 (Fig. 1) 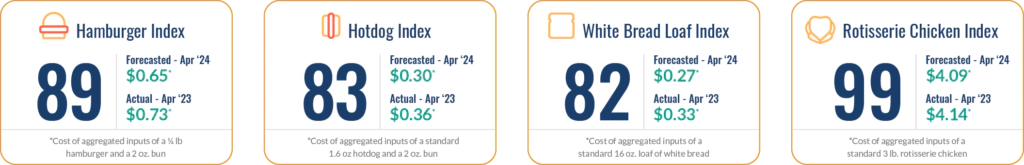 Figure 1 – DecisionNext finished goods indices for April 2024 (forecast locked on 3/4/24). To see last month’s index, click here.

March 2024 Index Report
The index values for Hot Dog, Hamburger and White Bread are all down from last year while Rotisserie Chicken remains more or less flat.
March Deep Dive
Looking ahead to April, Rotisserie Chicken prices are forecasted to be FLAT vs YRAGO, but we do not anticipate that to be the case over the next six months. In 2023, the input prices for Rotisserie Chicken peaked around $4.30 in May before falling back down to $3.60 in July. However, we are forecasting that input prices will climb steadily through the summer months, and could reach $5.00 or higher by August.
Despite feed input costs being $0.07/lb lower than this time last year, there are two main factors driving the forecasted rise in Rotisserie Chicken input costs.
- Plant Closures Tyson closed eight plants in 2023 to right-size supply against high costs, which will have an impact on pricing in 2024. So far, we’re seeing about a 2% reduction in slaughter levels.
- Freezer Stocks Due to high consumer demand, freezer stocks are 7% lower compared to last year and will continue to support pricing into 2024. With competing protein costs (particularly beef) at the consumer level, chicken sales should stay strong.
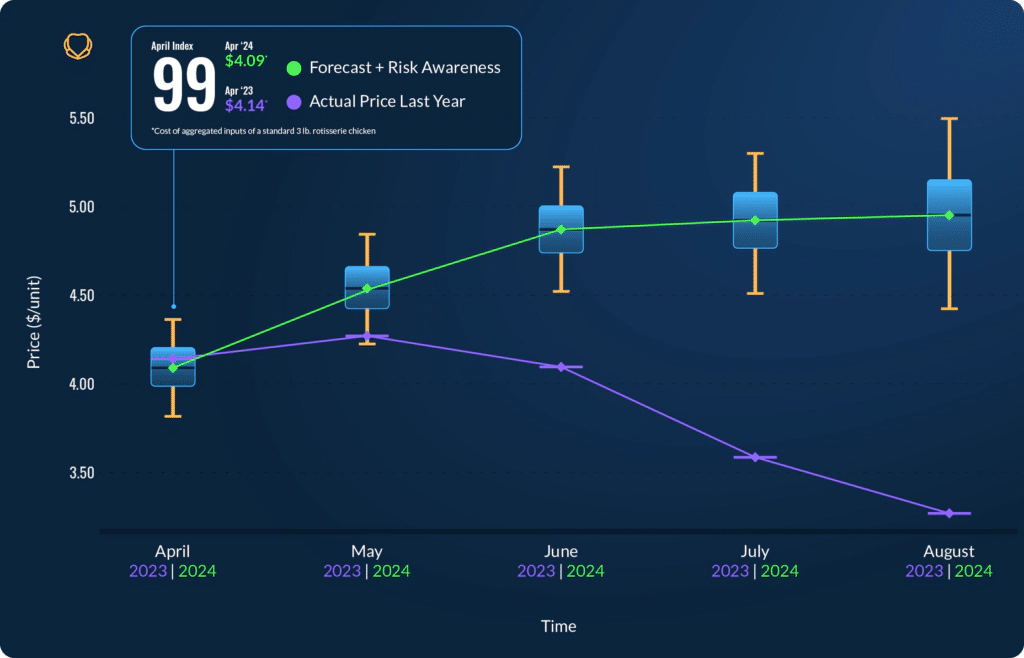 Figure 2 - Forecasted Rotisserie Chicken input costs Apr-Aug 2024 vs. actual costs over same period in 2023.
Using AI-assisted models, the DecisionNext team has developed a risk-aware forecast. In Figure 2, the box-and-whisker charts illustrate uncertainty around a median price forecast. We can then observe where 50% of forecast simulations fell (within the box) and where 90% of the simulations fell (within the whiskers). The greater the spread from the top of the box-and-whiskers to the bottom, the higher the uncertainty in the forecast.
The great thing about this quick visual is that it shows how our models identify key goods prices moving in the future. They also give valuable insight. You can see comparisons to last year and how it could impact your promotional strategies over the coming months.
Contact us if you want to see the six-month input cost forecast comparison for any of the other finished goods included in this report.
About the Report
Overall, the DecisionNext Finished Goods Index Report showcases the flexibility of our tool’s range of solutions. It offers multi-commodity forecasting for all major proteins and grains consolidated into a single finished goods forecast for illustration. The report also shows the ability to choose the timeframe for the forecast and the option to customize recipe templates to optimize finished goods profitability.
*How the Indices are Calculated: The index for each finished good is calculated by taking the forecasted aggregate price for the inputs for the month in question and dividing it by the historical aggregate price for those same inputs over the same time period last year. Essentially, we are using the tool to forecast the finished goods cost for the month, and then making the YoY comparison to the actual cost from the previous year for that same time period.
Sign up for our FREE newsletter, The Formula.
Every month you’ll get a Finished Good Report along with a deep dive, so you can start to track important trends over time.